Dashboard
The landing screen after sign-in. It answers one question — how is the business doing right now — from live data, with no date pickers to set.
DigitalKey ERP — Docs · digital-key.co/docs/getting-started/dashboard
Overview
The dashboard is read-only and always scoped to your own business. It refreshes each time you open it. Every amount is in your business's main currency.
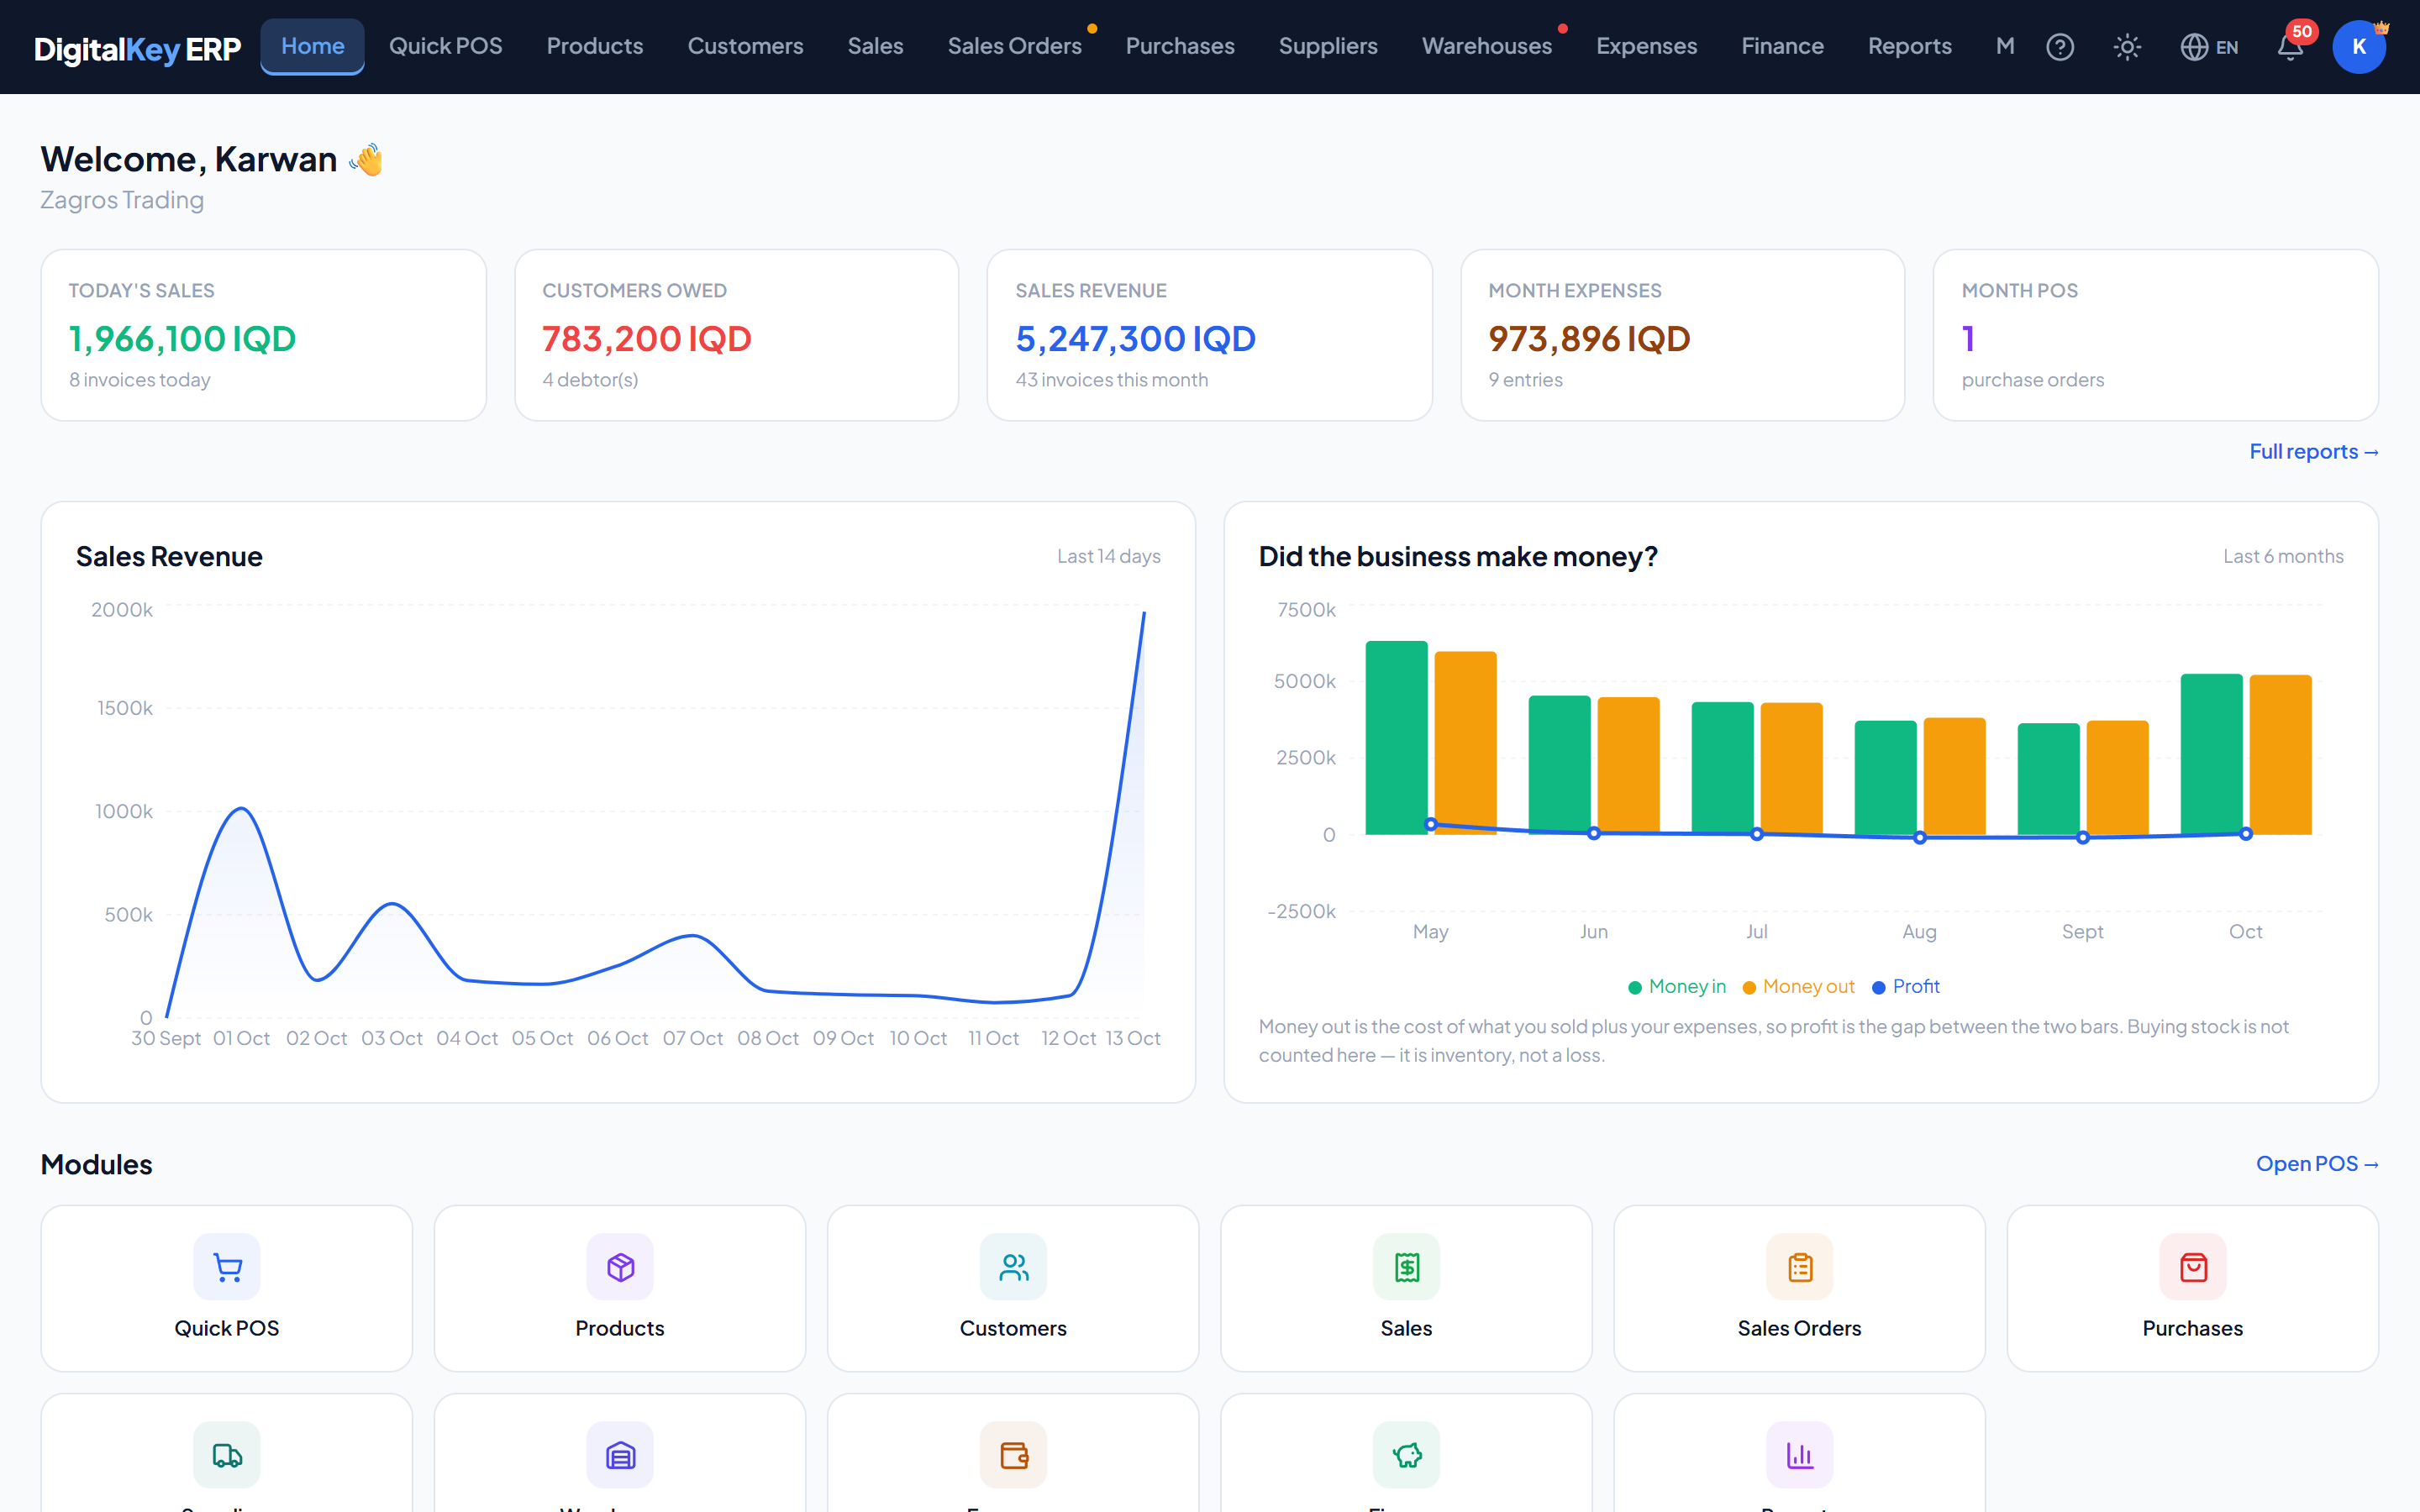
KPI cards
The row across the top summarises the business at a glance. “Today” means the current calendar day; “this month” means the current calendar month to date.
| Parameter | Type | Required | Description |
|---|---|---|---|
today_sales | decimal | Optional | Total value of sales completed today. |
today_count | integer | Optional | Number of sales completed today. |
month_sales | decimal | Optional | Total value of sales this calendar month to date. |
month_count | integer | Optional | Number of sales this month to date. |
total_debt | decimal | Optional | Total currently owed to you by all customers. |
debtor_count | integer | Optional | How many customers currently owe you money. |
month_expenses | decimal | Optional | Total expenses recorded this month. |
month_expense_count | integer | Optional | Number of expense entries this month. |
month_po_count | integer | Optional | Number of purchase orders raised this month. |
total_debt is a live balance across all customers, not a month-to-date figure. It does not reset when the month rolls over.The two charts
Two charts sit side by side under the KPI row.
Did the business make money?
The last six months as pairs of bars — Money in and Money out — with a line for Profit. Money out is the cost of what you sold plus your expenses, so profit is exactly the gap between the two bars; a line dipping under zero is a losing month. Buying stock is not counted — it is inventory, not a loss. The figures are the same ones the Finance screen charts, and the chart is shown to users who have finance.view.
Sales Revenue
Daily sales totals over the last 14 days, so you can see the shape of the fortnight rather than just a single number.
| Parameter | Type | Required | Description |
|---|---|---|---|
trend[].date | string | Optional | The day being plotted. |
trend[].amount | decimal | Optional | Total sales value for that day. |
Recent invoices
The latest sales, newest first. Selecting one opens it, from where it can be reprinted if you subscribe to invoice printing.
| Parameter | Type | Required | Description |
|---|---|---|---|
recent_invoices[].sale_id | integer | Optional | Internal sale identifier. |
recent_invoices[].invoice_no | string | Optional | The invoice number shown to customers. |
recent_invoices[].customer_name | string | Optional | Customer on the sale, or the walk-in customer. |
recent_invoices[].total | decimal | Optional | Invoice total. |
recent_invoices[].sale_date | timestamp | Optional | When the sale was completed. |
Top debtors
The customers who owe you the most, largest balance first — the shortlist to chase first. Selecting a customer opens their record.
| Parameter | Type | Required | Description |
|---|---|---|---|
top_debtors[].customer_id | integer | Optional | Customer identifier. |
top_debtors[].name | string | Optional | Customer name. |
top_debtors[].balance | decimal | Optional | Amount currently owed. |
Related
- Reports — deeper analysis over a date range you choose.
- Finance — profit and loss, cash flow and the ledger.
- Recording Payments — clearing customer debt.