Reports
Reports
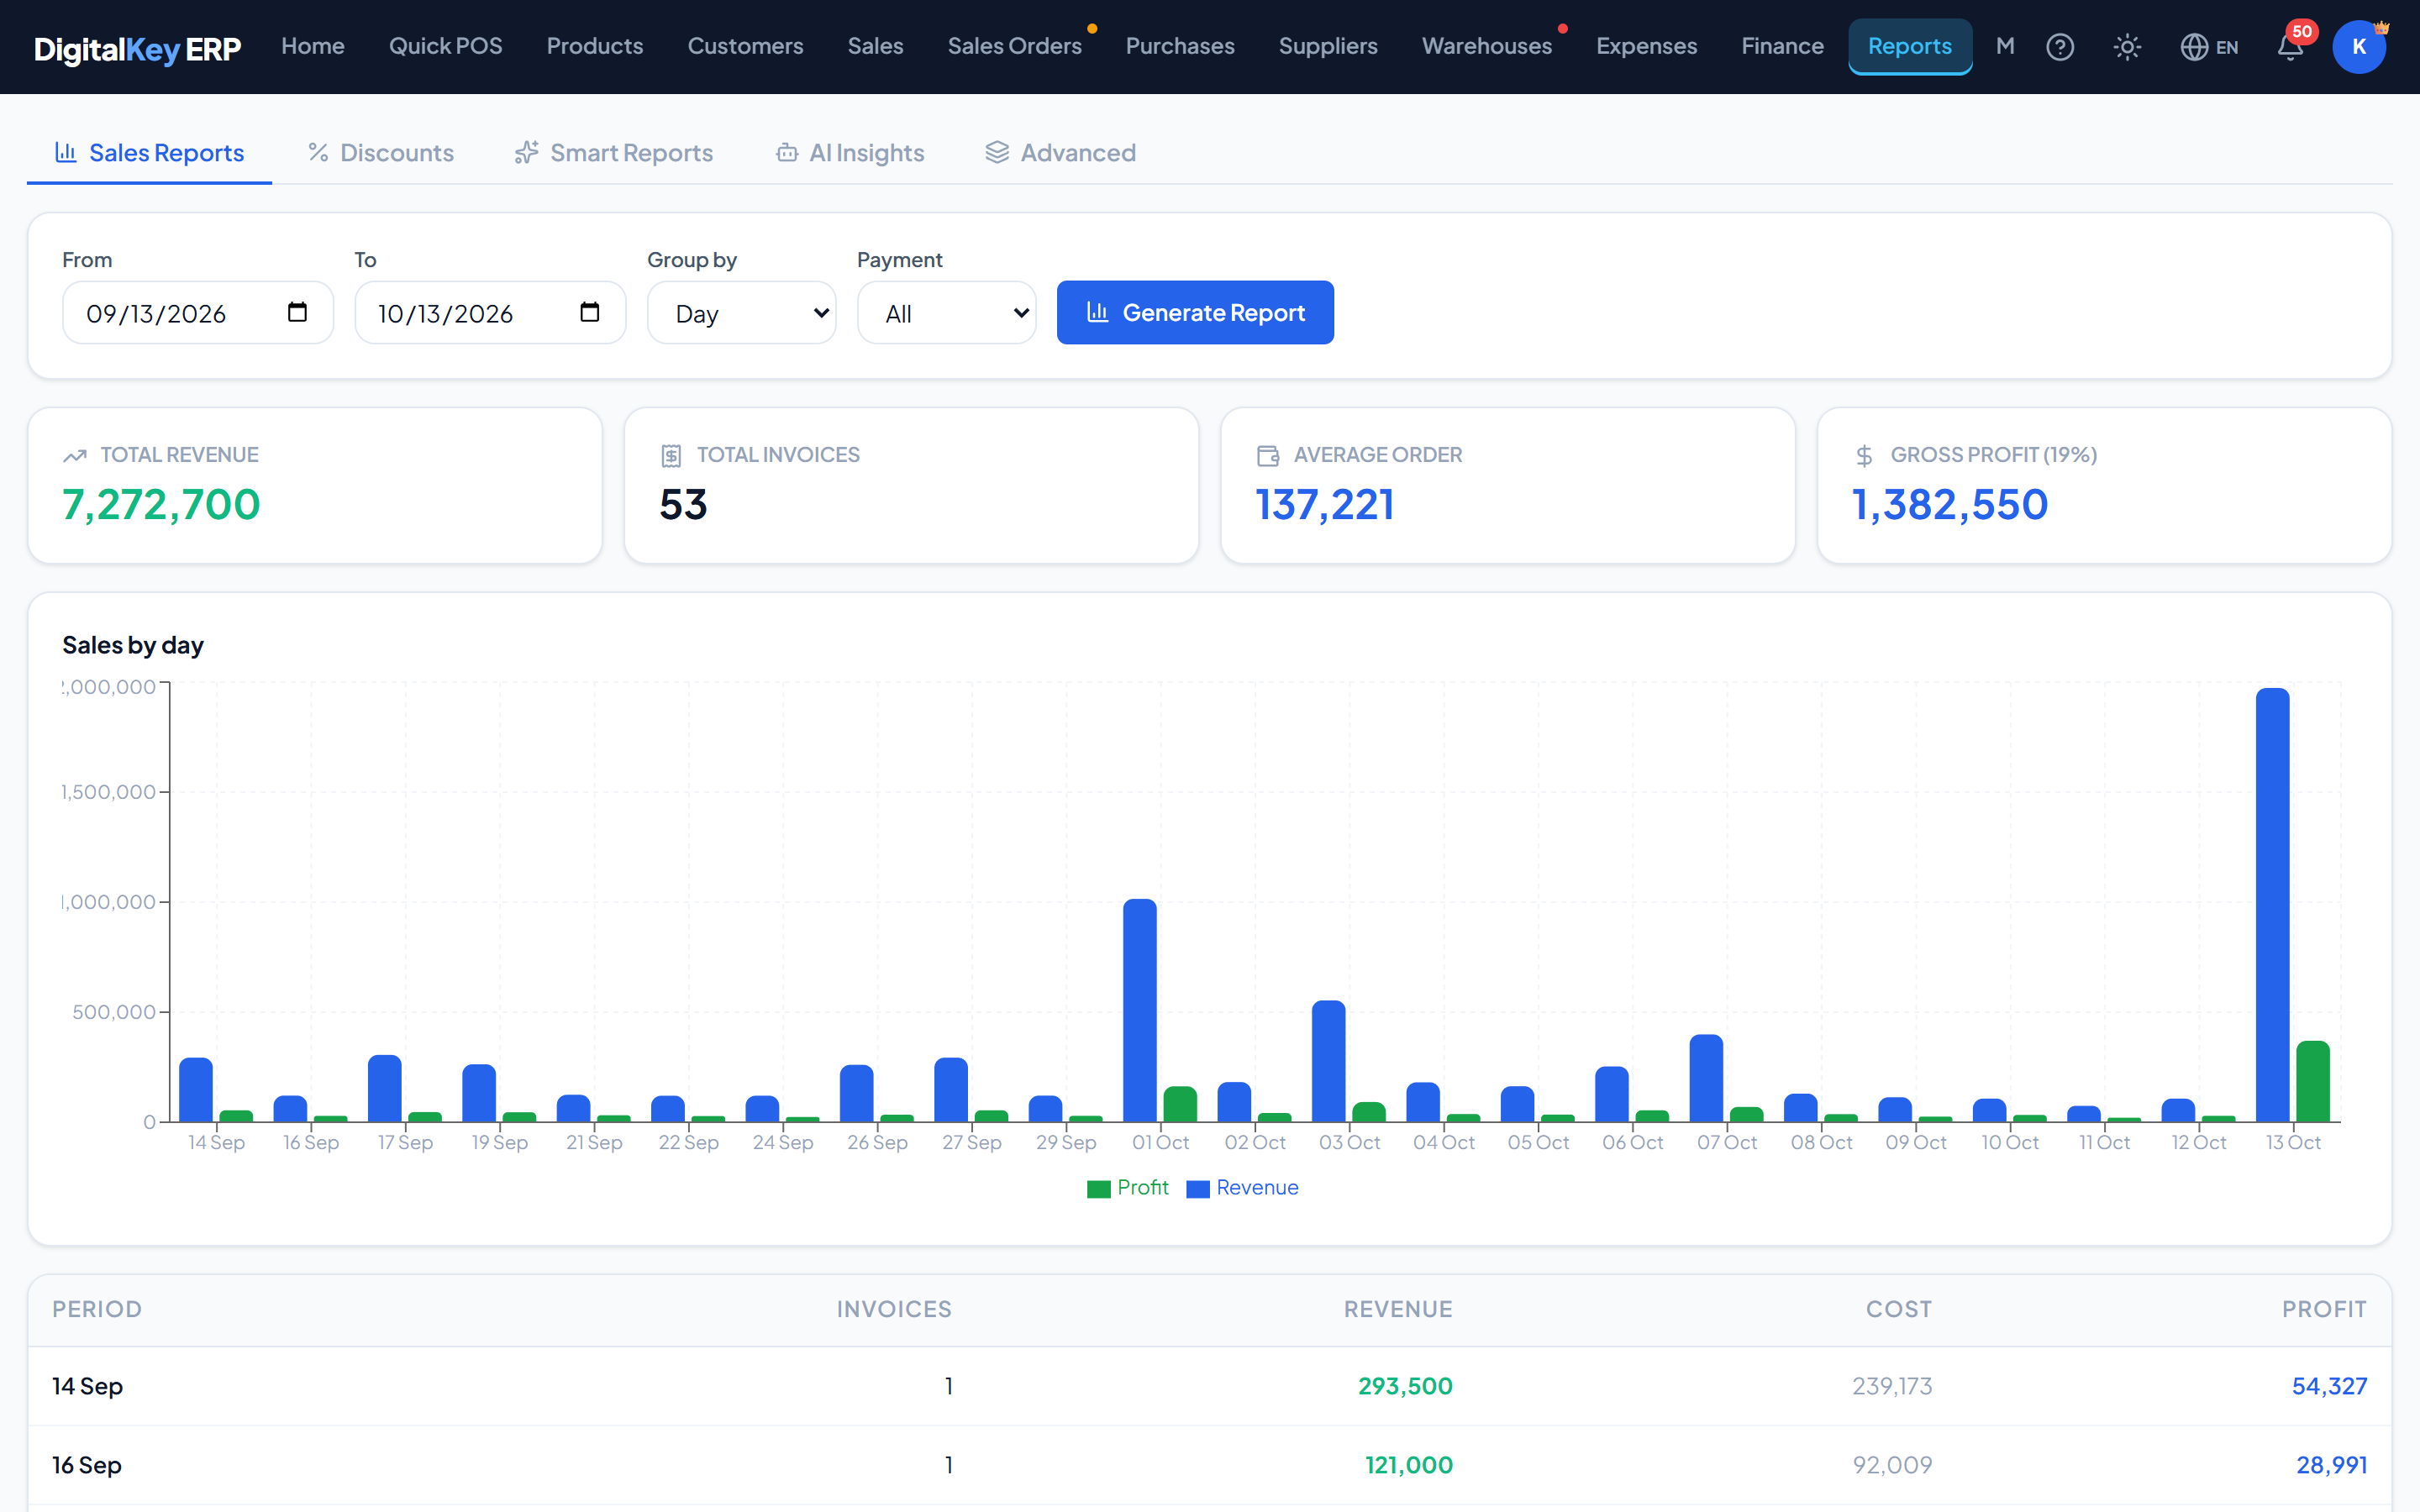
Analysis over a period you choose, rather than the fixed windows on the dashboard.
Last updated 2026-10-13
DigitalKey ERP — Docs · digital-key.co/docs/reports
Overview
Reports answer questions the dashboard cannot: what sold best last quarter, which customers are worth keeping, what has not moved in months. Every report takes a date range.
Reports — Reports screen
The reporting features
Reports module — monthly price in IQD
| Parameter | Type | Required | Description |
|---|---|---|---|
report.sales | 2,000 IQD | Optional | The Sales History screen, the sales report and the discounts report. |
report.advanced_dynamic | 2,000 IQD | Optional | Who bought what, and from whom — with every invoice line behind it. |
reports.smart_reports | 20,000 IQD | Optional | Dead stock, at-risk customers and the combined smart view. Includes the sales and discounts reports. |
reports.ai_analysis | 20,000 IQD | Optional | AI-generated marketing recommendations. |
Features that are no longer soldThe separate stock, customer, expense and discount report subscriptions (
report.stock, report.customer, report.expense, report.discount) have been withdrawn. Businesses that already hold one keep it. The discounts report now opens with the Sales Report or Smart Reports.The tabs
Reports screen
| Parameter | Type | Required | Description |
|---|---|---|---|
Sales Reports | report.sales | Optional | Revenue, cost, profit and the chart over a period, with top products and top customers. |
Discounts | report.sales | Optional | Item-level and invoice-level discounts given. |
Smart Reports | reports.smart_reports | Optional | Best sellers, dead stock and customers at risk. |
AI Insights | reports.ai_analysis | Optional | Generated recommendations in your language. |
Advanced | report.advanced_dynamic | Optional | The Advanced Dynamic Report. Its own product — not included in Smart Reports. |
Sales summary
GET /api/v1/reports/sales-summary
| Parameter | Type | Required | Description |
|---|---|---|---|
from_date | date | Required | Start of the period. |
to_date | date | Required | End of the period. |
group_by | string= day | Required | How data points are grouped along the period. |
category_id | integer | Optional | Restrict to one product category. |
payment_type | string | Optional | Restrict to cash or postpaid sales. |
What it returns
| Parameter | Type | Required | Description |
|---|---|---|---|
total_revenue | decimal | Optional | Total sold in the period, net of returns made in the period. |
total_cost | decimal | Optional | What those goods cost you when they were sold. |
gross_profit | decimal | Optional | Revenue less cost. |
profit_margin | decimal | Optional | Gross profit as a percentage of revenue. |
total_invoices | integer | Optional | Number of invoices. |
total_items | integer | Optional | Number of items sold. |
average_order_value | decimal | Optional | Revenue divided by invoice count. |
data_points[] | array | Optional | The series behind the chart, grouped as requested. |
TipAverage order value is one of the most actionable figures here. Raising it through bundling or upselling is usually cheaper than finding new customers to raise revenue by the same amount.
Standard reports
- Top products — best sellers by revenue or quantity, so you know what to keep in stock.
- Top customers — who spends the most, so you know who to look after.
Requires subscription
report.sales2,000 IQD / monthNoteVoided invoices are excluded from every report, and so are sales orders that have not been completed. A report run today for a past period can therefore differ from the same report printed earlier if something has been voided since.
The breakdowns are gross, the total is netThe headline revenue is net of returns. The grouped breakdowns — per day, top products, top customers — show what was sold before returns. When there are returns in the period, the breakdowns add up to more than the headline. Quantity columns count line units: a carton line counts as 1.
In this section
- Advanced Dynamic Report — who bought what, and from whom.
- Smart Reports — dead stock and at-risk customers.
- AI Business Insights — generated recommendations.